Stocks retrace April’s losses

Investment Communications Team, Investment Strategy Team, Wealth Management
Summary
Global equities rose by 4.1% in May (USD terms), while global government bonds edged higher by 0.5% (USD, hedged terms). Key themes included:
- Stock markets rebound, despite elevated bond yields;
- Fed signals a more cautious approach to easing relative to its European peers;
- Geopolitical backdrop remains uneasy in the Middle East, Ukraine and Taiwan.
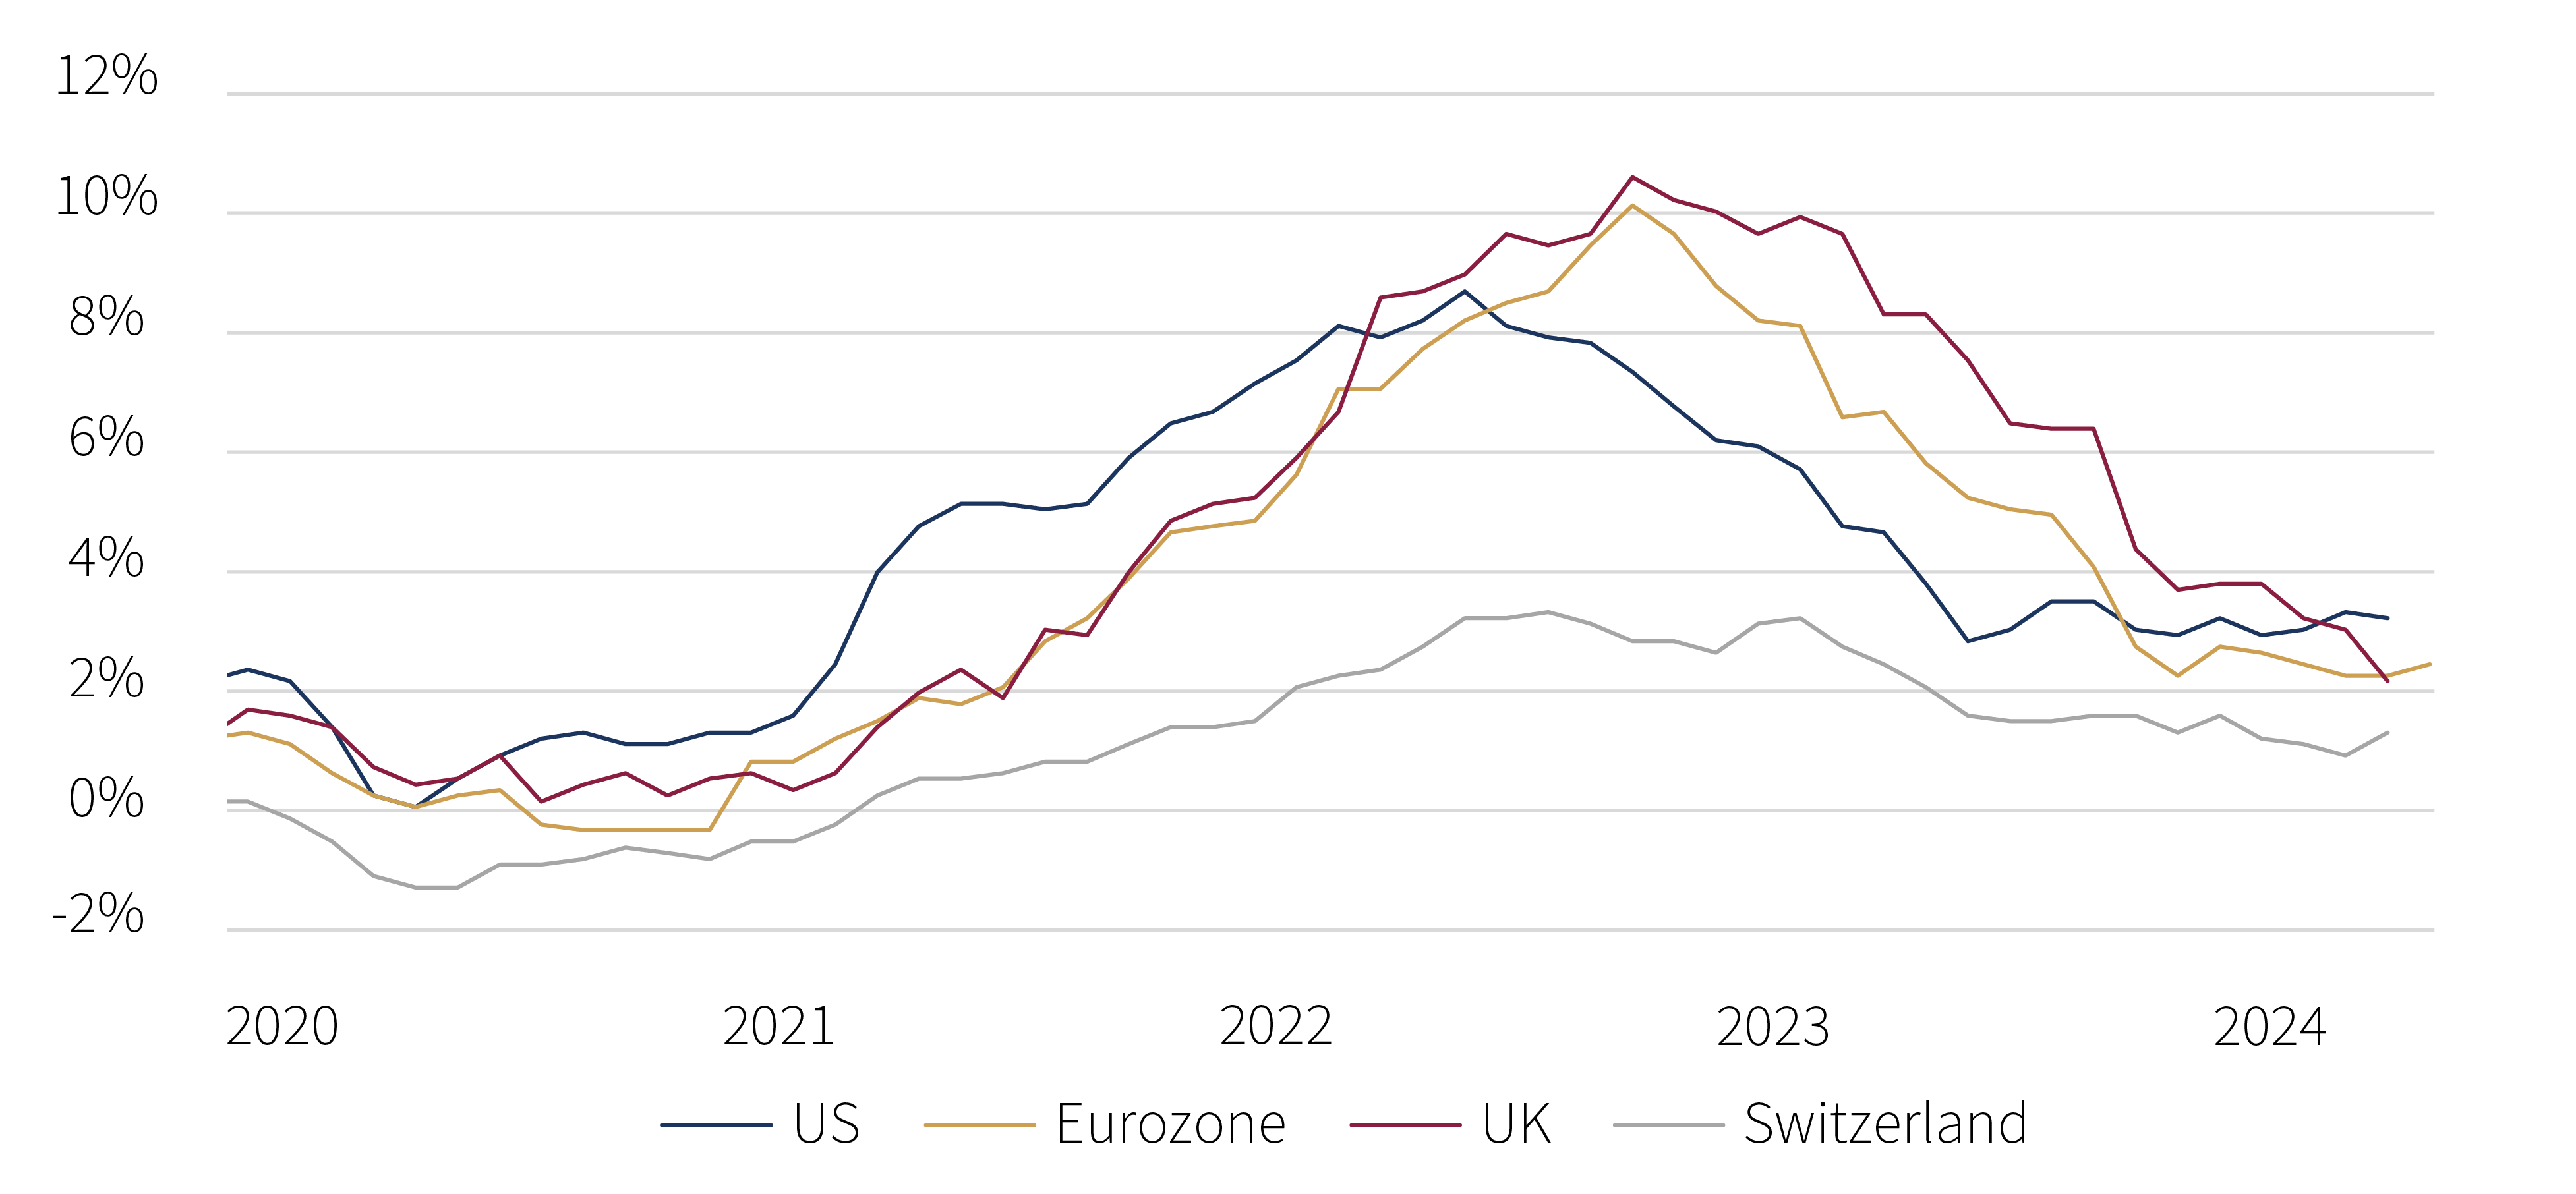
Headline inflation rates - Year-over-year (%)
Source: Rothschild & Co, Bloomberg
Markets: A better month for risk assets
Global stocks rebounded strongly in May, retracing the prior month’s losses – and briefly rising to all-time highs. Stock market participation broadened slightly, though the US mega-cap names continued to lead the market higher. The US first-quarter earnings growth rate was 5.9% (y/y) according to FactSet – stronger than consensus expectations – with significant contributions from those same mega-cap stocks. In fixed income, government bonds initially rallied during the first half of May, though reversed some of those gains later in the month: 10-year government bond yields touched fresh year-to-date highs in parts of Europe, such as Germany (2.7%) and the UK (4.4%) amid sticky inflation data. Commodities broadly continued to move higher, with the notable exception of Brent crude oil which fell by 7%.
Economy: Ongoing growth; sticky inflation
While US hard data were generally softer in April, real-time second-quarter GDP estimates continued to suggest another quarter of economic growth. The manufacturing survey data were mixed in May, with the ISM series edging lower to 48.7, yet the S&P Global series continued to signal expansion. There were tentative signs of labour market slackness in April: the unemployment rate crept up to 3.9% – still low by historical standards – while jobs growth and vacancies cooled. Encouragingly, US inflation met (rather than exceeded) expectations for the first time this year with April’s release. Both headline and core inflation moved lower, to 3.4% and 3.6% (y/y), respectively. In Europe, growth indicators continued to hold steady. The eurozone Composite PMI signalled a faster rate of growth in May, while the UK equivalent remained in ‘expansion’ territory. The UK GDP data also confirmed that it exited its brief technical recession at the turn of the year. Inflation data were stronger than expected, however: headline inflation accelerated in the eurozone (to 2.6%) and Switzerland (1.4%). UK headline inflation fell sharply to 2.3% following another drop in the Ofgem energy price cap, but services inflation (and wage growth) remained stubbornly high. In China, economic data were robust – consensus 2024 GDP estimates were tracking at close to 5% – but property sector issues remained unresolved, despite further government support measures.
Policy: Interest rates still poised to fall
The Federal Reserve left interest rates unaltered yet again in May, with Powell signalling that easing was postponed – but not cancelled. Conversely, in Europe, a more dovish narrative emerged: Sweden’s Riksbank was the second developed-market central bank to begin its easing cycle (after the Swiss National Bank), while the European Central Bank stood poised to cut in June. The Bank of England struck a more balanced, albeit divided tone: money markets were anchoring towards an autumn cut.
Meanwhile, the geopolitical landscape remained tense. Conflict in the Middle East showed few signs of resolve, Putin warned NATO on the use of their weapons provided to Ukraine, and China held military drills around Taiwan. Biden also announced further tariffs on China in critical areas, including semiconductors and electric vehicles. In the political sphere, Trump was found guilty on all counts in his “hush money” trail, making him the first former president to be convicted. In the UK, Sunak unexpectedly announced a general election for July, despite the Conservative’s weak local election results.
Performance figures (as of 31/05/2024 in local currency)
| Equity (MSCI indices $) | 1M % | YTD % |
|---|---|---|
| Global | 4.1% | 8.9% |
| US | 4.7% | 10.7% |
| Eurozone | 4.3% | 9.2% |
| UK | 3.6% | 8.8% |
| Switzerland | 8.1% | 1.7% |
| Japan | 1.3% | 7.0% |
| Pacific ex Japan | 3.4% | 0.4% |
| EM Asia | 1.4% | 5.8% |
| EM ex Asia | -2.7% | -5.0% |
| Fixed income | Yield | 1M % | YTD % |
|---|---|---|---|
| Global Govt (hdg $) | 3.43% | 0.5% | -1.0% |
| Global IG (hdg $) | 5.10% | 1.4% | -0.4% |
| Global HY (hdg $) | 8.29% | 1.2% | 3.2% |
| US 10Y | 4.50% | 1.8% | -2.8% |
| German 10Y | 2.66% | -0.2% | -3.8% |
| UK 10Y | 4.32% | 0.8% | -3.8% |
| Switzerland 10Y | 0.93% | -1.3% | -1.3% |
| Currencies (NEERs) | 1M % | YTD % |
|---|---|---|
| US Dollar | -0.7% | 3.0% |
| Euro | 0.5% | 1.1% |
| Pound Sterling | 0.8% | 2.7% |
| Swiss Franc | 0.2% | -4.9% |
Table note: NEERs under ‘currencies’ are the JP Morgan trade-weighted nominal effective exchange rates
| Commodities ($) | Level | 1M % | YTD % |
|---|---|---|---|
| Gold | 2,327 | 1.8% | 12.8% |
| Brent Crude oil | 82 | -7.1% | 5.9% |
| Natural gas (€) | 34 | 17.5% | 5.8% |
Source: Bloomberg, Rothschild & Co.

Read more articles
-

Macro update: polls, populists, policy and portfolios
Strategy Blog
In this strategy blog, we look at how polls, populists, policies and portfolios are affected by recent, and upcoming macro events.
-

Our culture, service and people
Insights
We pride ourselves on our company culture, values and people at Rothschild & Co Wealth Management UK. Our business is built on the strength of our people and the relationships they have with clients, and we believe this sets us apart from other wealth managers.
-

Sportonomics and the winners away from the arena
Thematic Insights
The Olympic motto 'citius, altius, fortius' - faster, higher, stronger - reflects the sport industry's rapid evolution. Younger generations are redefining their engagement with athletes and sports, driven by new technologies.
-

Making the best investment choices
Insights
There are many ways you can grow and preserve your wealth by investing. In this article we discuss how to find an investment style that suits your outlook, examine both ‘top-down’ or ‘bottom-up’ investing strategies, and assess active and passive investing.
-

How to choose a wealth manager
Insights
Wealth can be easily lost if you are not prudent. A wealth manager can help you avoid this fate, but you need to be confident that you're making the right choice. In this article we outline the key questions to ask and how they can hep you meet your financial goals.