


 21 / 204

Rothschild & Co | Annual Report 2017
19
1. Overview
4. Financial statements
3.
Management report
2. Business review
Shareholder information
2014
(12 months
to March)
2015
(12 months
to March)
2016
(12 months
to March)
2017
(12 months
to March)
2017
(12 months
to December)
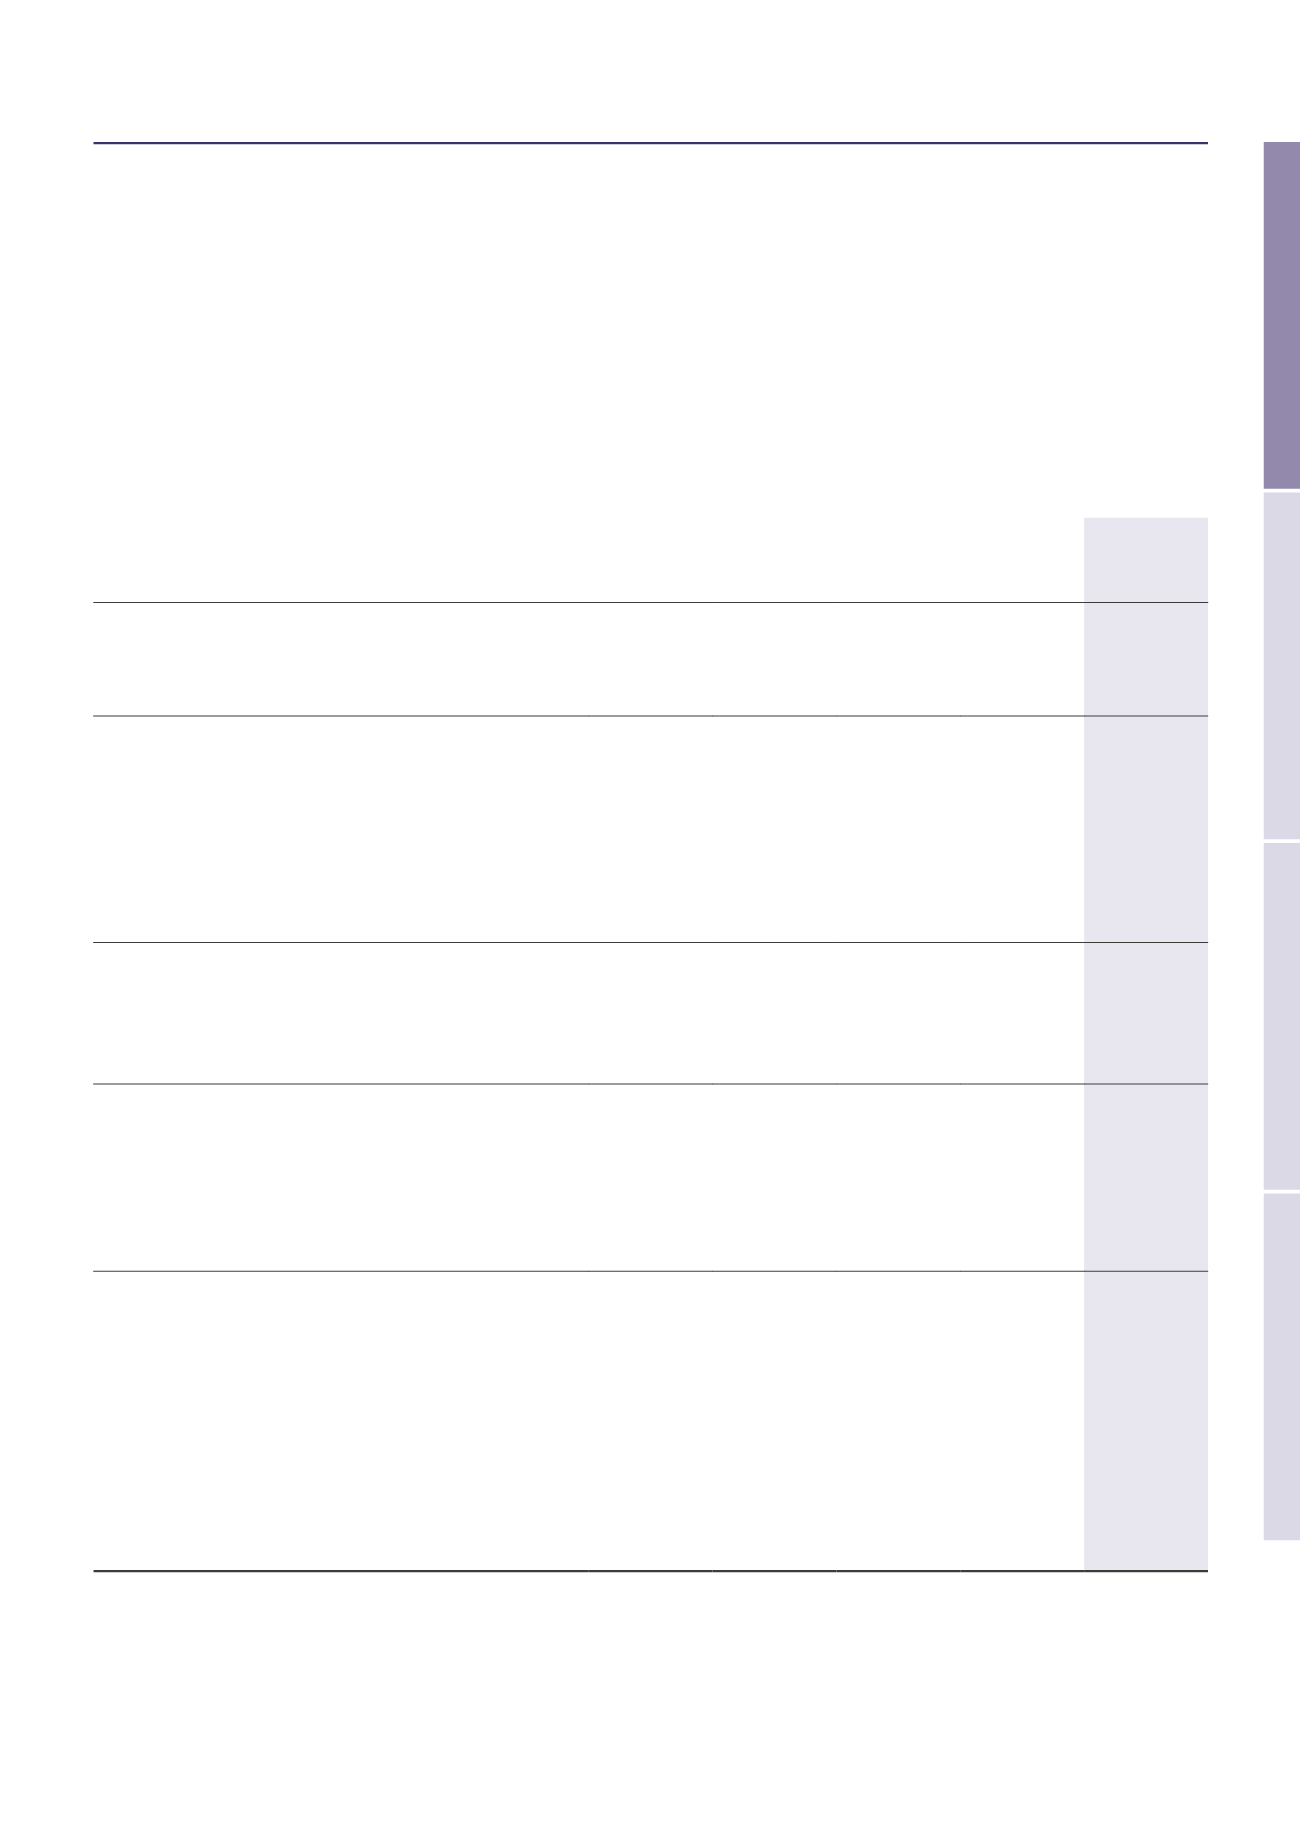
Market capitalisation (in millions of euro)
1,280
1,403
1,546
2,077
2,364
Share price (in euro)
At the end of the financial year
18.0
19.7
21.7
26.9
30.5
Maximum
20.7
19.7
30.1
28.0
32.5
Minimum
16.8
16.4
19.1
20.2
25.6
Yearly average
18.1
17.6
24.5
23.3
29.2
Number of shares and investment certificates
Issued
71,104,108 71,137,036 71,137,036 77,290,012
77,407,512
Of which treasury shares
644,197
442,701
551,434 1,054,574
909,770
Per share (in euro)
Dividend
0.50
0.60
0.63
0.68
0.68
(1)
Earnings per share (EPS)
0.11
2.08
3.37
2.64
3.18
EPS excluding exceptional items
0.74
2.31
1.95
2.74
3.33
Market data
Total value traded (in millions of euro)
65.7
63.8
307.0
151.2
355.1
Total trading volume
3,741,749 3,463,602 12,636,659 6,369,137
12,056,919
Average daily traded volume
14,616
13,583
49,556
24,497
47,279
% traded on Euronext
84%
65%
37%
46%
49%
% traded on Electronic and OTC platforms
16%
35%
63%
54%
51%
Excluding exceptional block trades
(2)
over the period
Total value traded (in millions of euro)
37.2
63.8
213.4
117.3
312.7
Total trading volume
2,141,749 3,463,602 8,846,659 4,942,137
10,568,848
Average daily traded volume
8,366
13,583
34,693
19,008
41,446
Market data
(1) Dividend proposed at the Annual General Meeting to be held on 17 May 2018. This dividend is payable for the nine-month period (April-December).
(2) Exceptional block trades over 300,000 shares.