


 109 / 204

Rothschild & Co | Annual Report 2017
107
1. Overview
4. Financial statements
3.
Management report
2. Business review
(1) For more information on water use data, please refer below to the additional data notes.
(2) For more information on materials use data, please refer below to the additional data notes.
(3) For more information on energy use data, please refer below to the additional data notes.
Water use data
(1)
Water consumption in m
3
01/01/17
31/12/17
(12 months)
01/04/16
31/03/17
(12 months)
Water Consumption
43,657.4
42,253.7
m
3
/FTE
15.17
14.93
4.3.2.2 CONSUMPTION OF RAW MATERIALS AND MEASURES
TO IMPROVE EFFICIENCY IN THEIR USE
Raw materials are interpreted predominately to mean paper, although an
increase in reporting scope over the years has resulted in more material
types being added. With that said, 2017 saw an expansion in the amount
of 100% recycled paper being used for everyday printing. The use of 100%
recycled paper promotes circular economy practices and helps reinforce our
commitment to the Sustainable Development Goal 12 defined by the United
Nations (responsible consumption and production). In the coming years, the
Group will further expand the use of sustainably sourced material.
In 2017, materials use has seen a decrease of about 5%. This was due
mainly to more accurate data collection for some offices reporting for the
second time as well as initiatives in offices to reduce consumption and,
where available, favour recycled alternatives.
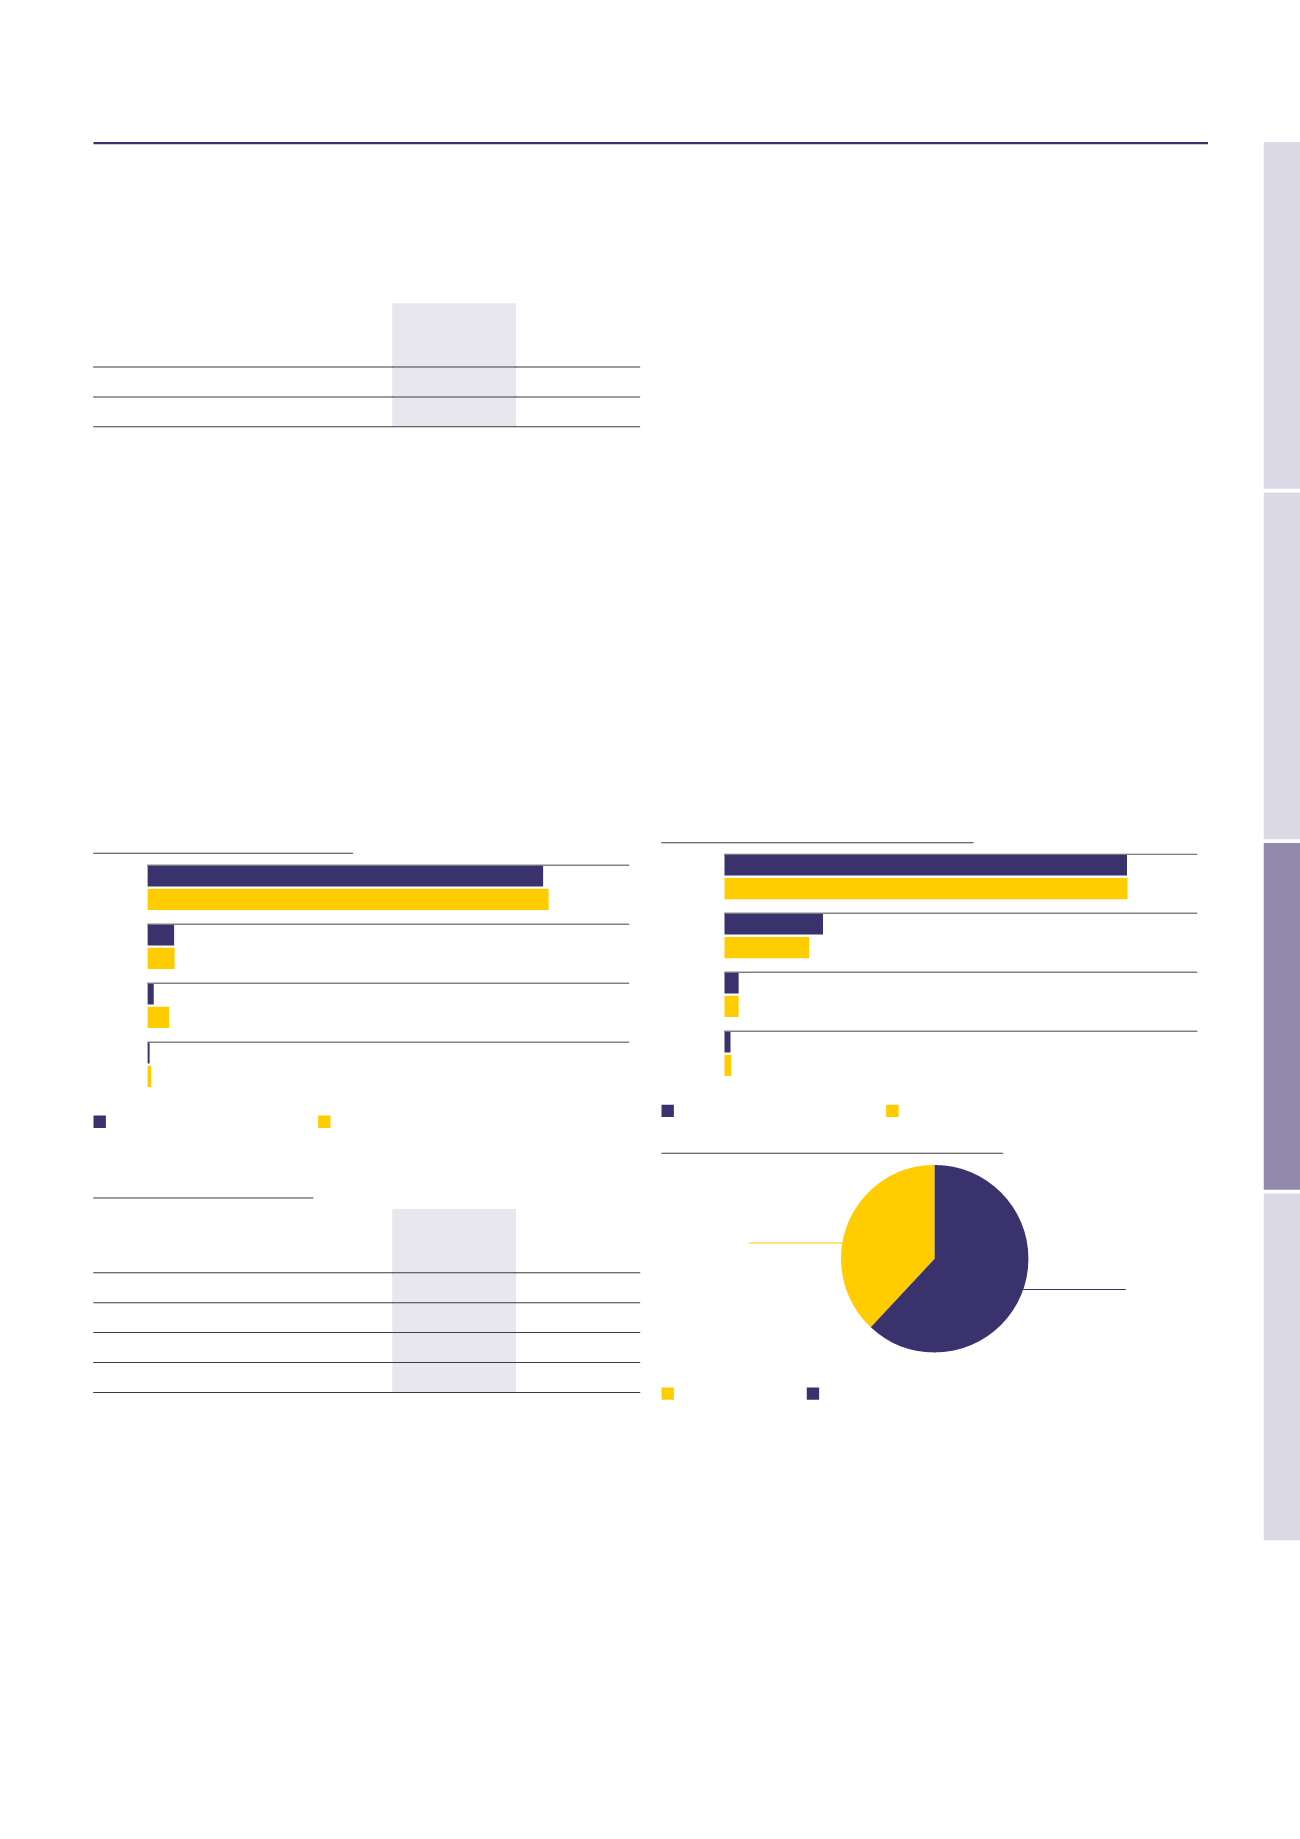
Materials use data
(2)
Group breakdown by use (in tonnes)
Office
paper
Paper
towels
Plastics
Paper
cups
193.7
196.4
13.0
13.2
3.0
10.5
1.0
1.7
12 months to 31 March 2017
12 months to 31 Dec 2017
Responsibly sourced materials
Materials use in tonnes
01/01/17
31/12/17
(12 months)
01/04/16
31/03/17
(12 months)
Recycled content
41.19
38.06
Non-recycled content
169.52
183.7
Total materials consumption
210.7
221.8
Tonnes/FTE
0.07
0.08
4.3.2.3 ENERGY CONSUMPTION AND MEASURES TO IMPROVE
ENERGY EFFICIENCY
Fossil fuels are a major contributor to electricity production and, as a
consequence, contribute to greenhouse gas emissions. Electricity plays
a major role in business communications and connectivity, yet about
1 in 5 people in the world do not have access to electricity. Global growth
of renewable, sustainable energy continues and governments and
businesses are in a strong position to drive that growth.
Over the past few years the Group has identified energy efficiency
opportunities and energy-saving actions for office operations. In addition,
the Group procures about 38% of its electricity from certified renewable
sources and it intends to further expand the purchasing of renewable
energy in due course. Further purchases will help stimulate economic
growth and reduce greenhouse gas emissions, which is in line with the
Group’s commitments to Sustainable Development Goals 7 (affordable and
clean energy), 8 (decent work and economic growth) and 13 (climate action)
defined by the United Nations.
Energy consumption has increased marginally. This has been driven by an
increase of gas consumed in one office. The building management team
have identified that both the competing comfort demands of staff members
and some faulty machinery are causing the building to work less efficiently.
Energy use data
(3)
Group breakdown by energy use (in tonnes)
Electricity
Natural
Gas &
Biogas
Heat
Gasoil/
Diesel
13,964.9
13,982.7
3,416.8
2,931.5
490.2
490.2
210.2
235.7
12 months to 31 March 2017
12 months to 31 Dec 2017
Group breakdown by electricity sources in 2017
Renewables
Non-renewables
38%
62%